Industrial Automation Guide 2026: Costs, ROI & Trends

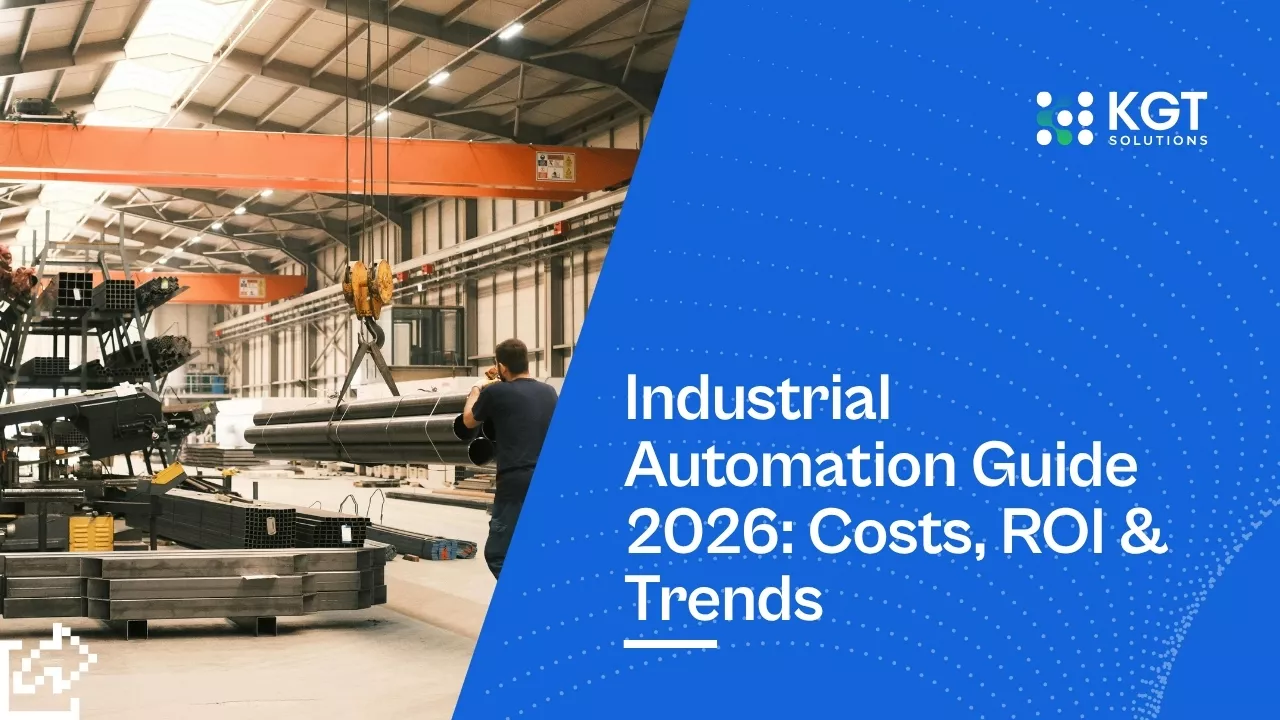
Industrial automation cuts unplanned downtime 30-50% and delivers 10:1 to 30:1 ROI within 18 months. Here is how the math works.
Industrial automation is the use of control systems, robotics, and data-driven software to run manufacturing processes with minimal human input - cutting downtime by 30-50%, delivering 10:1 to 30:1 ROI within 18 months, and solving the labor crisis hitting every plant floor today.
Key Takeaways
The industrial automation market hit $261 billion in 2026 and is growing at 9.7% CAGR toward $455 billion by 2033 - meaning your competitors are investing now, not later.
Predictive maintenance alone reduces unplanned downtime by 30-50% and pays for itself in 8-14 months, with 95% of adopters reporting positive ROI.
Machine vision systems catch defects at 90%+ accuracy rates while delivering 200-300% ROI - and keyword difficulty is only 32%, meaning this is a wide-open content gap most manufacturers ignore.
Introduction
Unplanned downtime costs the average plant $260K per hour. This guide walks through what tech to buy, what it actually costs, and what order to install it.
Every hour of unplanned downtime costs the average manufacturer $260,000. Most plants still run reactive maintenance, manual inspection, and decade-old PLCs that cannot talk to each other. This guide breaks down exactly what works in industrial automation right now - the technologies, the math, the implementation order, and the traps to avoid.
What Is Industrial Automation and Why Does It Matter in 2026?
Industrial Automation Market Growth (2026-2033)
Global market projected from $261B to $455B at 9.7% CAGR, driven by retrofits, labor shortages, and AI integration

Industrial automation replaces manual work with sensors, PLCs, and AI that run your plant 24/7 without fatigue. The market hit $261B in 2026.
Industrial automation replaces manual factory processes with programmable control systems, sensors, and AI-driven software that operate equipment continuously without fatigue, error, or breaks - producing consistent output at speeds and precision levels humans physically cannot match.
The $261 billion industrial automation market in 2026 is not a projection anymore. It is the current spend. Fortune Business Insights pegs growth at 9.7% CAGR through 2033, reaching $455 billion.
That growth is not coming from greenfield plants in emerging markets alone. It is coming from retrofits.
Plants built in the 1990s and early 2000s are hitting a wall. The workforce that knew how to run them is retiring. The equipment is degrading faster than maintenance budgets can keep up.
Customer tolerance for defects and delays has dropped to near zero.
Industrial automation solves three problems simultaneously: it fills labor gaps without hiring wars, it catches failures before they cause shutdowns, and it produces quality data that feeds business intelligence upstream. It is the bridge to smarter operations for plants stuck between legacy equipment and modern demand.
The Three Layers of Modern Industrial Automation
Three layers: sensors grab data, PLCs and SCADA run the equipment, AI spots problems before they happen.
Modern industrial automation operates across three layers - the physical layer (sensors and actuators), the control layer (PLCs and SCADA), and the intelligence layer (AI, ML, and predictive analytics) - each feeding data upward for smarter decisions.
Here is how the stack works in practice:
Physical layer: Vibration sensors, temperature probes, pressure transducers, cameras, and proximity sensors. These are the eyes and ears bolted onto your equipment. Average sensor cost dropped 40% since 2022.
Control layer: PLCs (Programmable Logic Controllers) execute real-time commands. SCADA systems supervise and log everything. HMIs let operators see what is happening. This layer has existed for decades - the difference now is connectivity.
Intelligence layer: Edge computing devices process sensor data locally. Cloud platforms aggregate it. Machine learning models find patterns humans miss. This layer turns raw signals into predictions and prescriptions. The convergence of AI and factory hardware is riding the AI wave with industrial automation in ways most plants have not explored yet.
The mistake most plants make is jumping to the intelligence layer without fixing the physical and control layers first. If your sensors are uncalibrated or your PLCs cannot export data, AI has nothing to work with.
Fixed vs. Programmable vs. Flexible Automation
Fixed automation makes one thing really fast. Programmable switches between batches. Flexible handles mixed products without stopping the line.
Fixed automation handles high-volume, single-product lines at maximum speed. Programmable automation allows batch changeovers through code updates. Flexible automation adapts to mixed products in real-time without stopping - and it is what most plants need in 2026.
Type | Best For | Changeover Time | Capital Cost | Example |
|---|---|---|---|---|
Fixed | 100K+ identical units/year | Days to weeks | $2M-$10M+ | Automotive body welding |
Programmable | Batch runs of 500-50K | Hours | $500K-$3M | Pharmaceutical packaging |
Flexible | Mixed SKUs, custom orders | Minutes to zero | $200K-$2M | Electronics assembly |
Most mid-market manufacturers need flexible automation. They do not run one product forever. They have 15-40 SKUs, seasonal demand shifts, and customers demanding shorter lead times.
Flexible automation - built on collaborative robots, vision-guided systems, and adaptive PLCs - lets them switch without losing an entire shift to retooling.
How Predictive Maintenance Eliminates Unplanned Downtime
Predictive maintenance spots equipment failures 2-6 weeks early and cuts unplanned downtime 30-50%. Most systems pay for themselves in under a year.
Predictive maintenance uses vibration analysis, thermal imaging, and machine learning to detect equipment failure 2-6 weeks before it happens - reducing unplanned downtime by 30-50% and maintenance costs by 18-25% compared to reactive or calendar-based approaches.
The US Department of Energy studied this extensively. Their findings: predictive maintenance reduces breakdowns by 70-75%, cuts maintenance costs by 25-30%, and extends equipment lifespan by 20-40%. Here is a deeper look at how predictive maintenance reduces unplanned downtime with real facility data.
These are not vendor marketing numbers. They come from federal research across hundreds of industrial facilities.
Here is the math that makes plant managers move fast. If your line runs at $15,000 per hour in output and you experience 200 hours of unplanned downtime per year, that is $3 million in lost production.
A predictive maintenance system typically costs $150K-$400K to deploy across a mid-size plant. Even a 30% reduction in downtime saves $900K in year one.
The payback period? 8-14 months. After that, it is pure margin.
What Predictive Maintenance Software Actually Does
The software watches vibration, heat, and electrical data from your machines, then uses pattern matching to warn you weeks before something fails.
Predictive maintenance software ingests sensor data streams - vibration signatures, temperature curves, current draw patterns, acoustic emissions - and applies ML models trained on historical failure data to flag anomalies that precede specific failure modes by weeks.
The workflow looks like this:
Sensors capture continuous data from critical assets (motors, pumps, compressors, bearings, gearboxes)
Edge devices pre-process and filter noise locally
ML models compare current signatures against known failure patterns
The system generates work orders ranked by urgency and failure probability
Maintenance teams fix problems during planned windows instead of emergency scrambles
The key insight most vendors hide: you need 6-12 months of clean historical data before ML models become accurate. During that period, the system learns what "normal" looks like for YOUR specific equipment in YOUR specific environment.
Off-the-shelf models trained on generic data give you false positives that erode operator trust. That is exactly why most predictive maintenance software predicts nothing in its first year.
ROI Breakdown: Reactive vs. Preventive vs. Predictive
Waiting for things to break costs 3-9x more per repair than fixing them early. Overtime, rush-shipped parts, and damage to nearby equipment add up fast.
Reactive maintenance costs 3-9x more per repair than predictive maintenance because emergency repairs require overtime labor, expedited parts, production penalties, and collateral damage to adjacent systems - all avoidable with 2-6 weeks of advance warning.
Metric | Reactive | Preventive (Calendar) | Predictive |
|---|---|---|---|
Cost per repair | $10K-$50K | $3K-$15K | $1K-$8K |
Downtime per event | 4-48 hours | 1-4 hours (planned) | 0.5-2 hours (planned) |
Parts waste | High (emergency orders) | Medium (over-replacement) | Low (just-in-time) |
Labor efficiency | 35-45% | 55-65% | 80-90% |
Equipment lifespan impact | Shortened 20-40% | Neutral | Extended 20-40% |
The hidden cost of calendar-based preventive maintenance: you replace parts that still have 40-60% useful life remaining. That is pure waste.
Predictive maintenance lets you run components to 85-95% of their actual lifespan before replacing them - because you know exactly when failure is approaching.
Maintenance Strategy Comparison: Cost, Downtime & Efficiency
Reactive repairs cost 3-9x more per event than predictive fixes due to overtime labor, expedited parts, and collateral damage
| Metric | Reactive | Preventive (Calendar) | Predictive |
|---|---|---|---|
| Cost Per Repair | $10K - $50K | $3K - $15K | $1K - $8K |
| Downtime Per Event | 4 - 48 hours | 1 - 4 hours (planned) | 0.5 - 2 hours (planned) |
| Parts Waste | High (emergency orders) | Medium (over-replacement) | Low (just-in-time) |
| Labor Efficiency | 35 - 45% | 55 - 65% | 80 - 90% |
| Equipment Lifespan | Shortened 20-40% | Neutral | Extended 20-40% |

Machine Vision Systems: The Quality Gate That Never Blinks
Machine vision inspects 100 to 2,000 parts per minute and catches defects that human inspectors miss after hour four. Most plants see 200-300% ROI.
Machine vision systems use high-resolution cameras, structured lighting, and deep learning algorithms to inspect products at speeds of 100-2,000 parts per minute - catching defects as small as 0.01mm that human inspectors miss 20-30% of the time.
Human inspectors are good for about 4 hours before fatigue sets in. After that, miss rates climb. By hour 8, a typical inspector catches only 70-80% of defects. Even automated systems have blind spots - here is why machine vision systems miss defects and how to fix them.
Machine vision catches what humans miss - consistently, at full speed, 24/7.
The technology has hit an inflection point. Five years ago, you needed custom-trained neural networks and specialized vision engineers to deploy a system. That is why most computer vision projects fail before reaching production - bad scoping kills them before bad data does.
Today, pre-trained models handle 80% of common inspection tasks (surface defects, dimensional verification, color matching, label reading) with minimal configuration. The remaining 20% still needs custom work - but that 80% is enough for most manufacturers to see 200-300% ROI.
Where Machine Vision Delivers Immediate Impact
Machine vision pays back fastest on surface defects, part measurements, assembly checks, and barcode reading.
Machine vision delivers fastest ROI in four applications: surface defect detection on continuous production lines, dimensional measurement for tolerance-critical parts, assembly verification for multi-component products, and barcode/label reading for packaging compliance.
Surface inspection: Cameras and AI detect scratches, dents, cracks, discoloration, and contamination on metals, plastics, glass, and textiles. Accuracy rates hit 90-99% depending on defect type and training data quality.
Dimensional measurement: Non-contact measurement at micron precision. Replaces CMMs (Coordinate Measuring Machines) for in-line checks, cutting inspection time from minutes to milliseconds.
Assembly verification: Confirms all components are present, correctly oriented, and properly seated. Eliminates "missing washer" and "wrong screw" defects that cause field failures.
Print and label verification: Reads barcodes, verifies text, checks placement and alignment. Critical for pharma, food, and regulated industries where a misprint means a recall.
The investment range for a single-camera station runs $15K-$80K depending on resolution, lighting complexity, and software licensing. Multi-camera systems for full product coverage can reach $200K-$500K.
When a single escaped defect triggers a $500K recall, the math is obvious.
Automation ROI Breakdown: $1.2M Investment, $1.525M Annual Return
Mid-size food manufacturer - 3 packaging lines automated with vision inspection, case packing, and predictive maintenance
The Real ROI of Industrial Automation: Numbers, Not Promises
When you add up labor savings, less downtime, lower scrap, and energy cuts, most plants see 10:1 to 30:1 returns within 18 months.
Industrial automation delivers measurable ROI of 10:1 to 30:1 within 12-18 months for most manufacturing deployments - driven by reduced labor costs (40-60%), eliminated downtime losses (30-50%), lower scrap rates (50-90%), and decreased energy consumption (10-30%).
Let's kill the vague language that vendors use. Here is what "real ROI of industrial automation" looks like with actual numbers:
A mid-size food manufacturer running 3 packaging lines invested $1.2M in automation (vision inspection, automated case packing, predictive maintenance on conveyor motors). Their annual savings breakdown:
Labor reduction (eliminated 2 shifts of manual inspectors): $480K/year
Downtime reduction (42% fewer unplanned stops): $620K/year
Scrap reduction (defect escape rate dropped from 3.2% to 0.4%): $340K/year
Energy optimization (motors running at optimal speeds): $85K/year
Total annual savings: $1.525M on a $1.2M investment
That is a 9.5-month payback. Year 2 onward is $1.525M in pure margin improvement. Use the ROI calculator to justify your CapEx in 90 days with numbers your CFO will accept.
Hidden Costs Nobody Talks About
Hidden costs push payback out 2-4 months: integration $50-200K, training $20-80K, security $30-100K, licensing $15-60K/year.
The hidden costs of industrial automation include integration complexity ($50K-$200K for legacy system connectivity), staff retraining ($20K-$80K per technician cohort), cybersecurity hardening ($30K-$100K for OT network segmentation), and ongoing software licensing ($15K-$60K annually).
Nobody wants to hear this, but here is the truth about hidden costs:
Integration: Your 15-year-old PLCs speak Modbus. Your new analytics platform speaks MQTT. Someone has to build that bridge. Budget $50K-$200K for integration middleware and protocol converters.
Training: Your maintenance team knows wrenches and multimeters. Now they need to understand data dashboards, alarm prioritization, and basic troubleshooting of networked systems. Budget $20K-$80K per training cohort.
Change management: The operators who have run those lines for 20 years will resist. They are not wrong to be cautious - they have seen "upgrades" fail before. Budget time and leadership attention, not just money.
These costs do not kill ROI. They delay it by 2-4 months. Ignore them entirely and you are looking at the real cost of bad industrial automation - a system that collects dust instead of data.
But if you do not budget for them, you end up with a $2M system running at 40% capability because nobody trained the people who operate it.
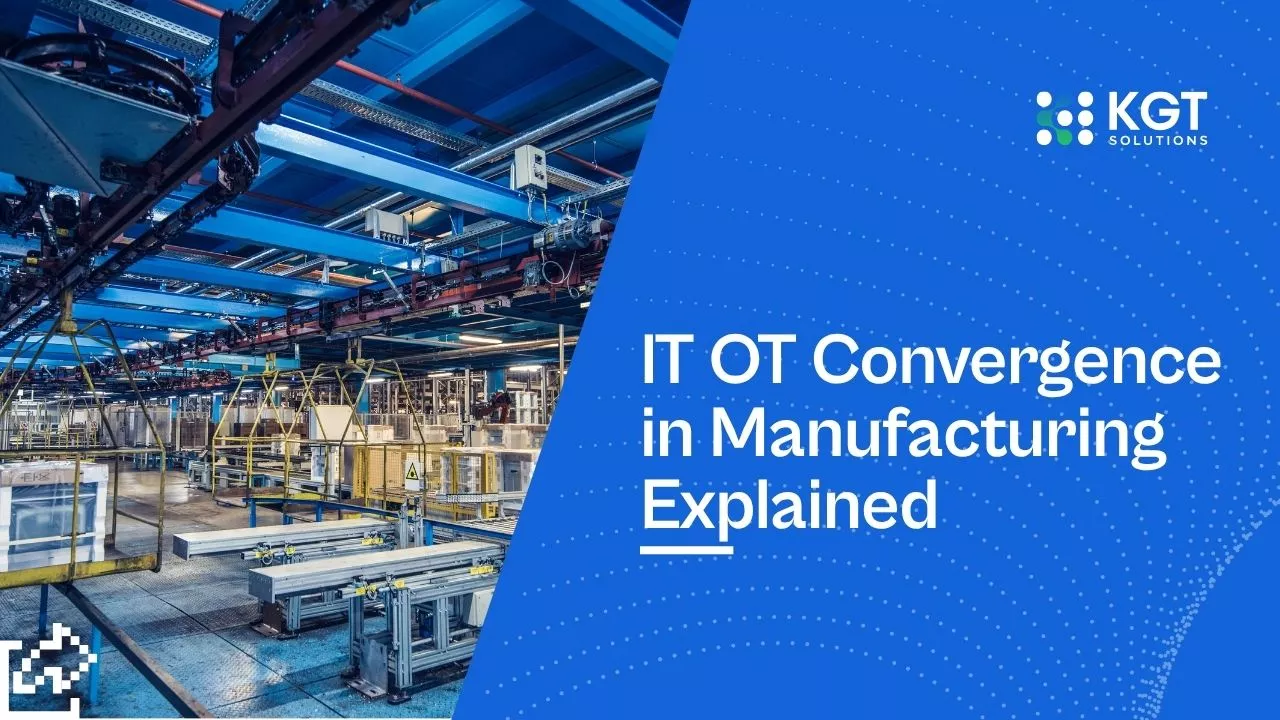
IT OT Convergence in Manufacturing Explained
How Industrial Automation Solves the Manufacturing Labor Shortage
Manufacturing Labor Shortage: The Automation Imperative
Automation fills labor gaps without mass layoffs, upskilling remaining workers into higher-value roles
Over 600,000 manufacturing jobs sit unfilled in the US right now. Automation fills those gaps without layoffs and pays remaining workers 15-25% more.
Industrial automation directly solves the manufacturing labor shortage - currently 600,000+ unfilled positions in the US alone - by automating repetitive, ergonomically harmful, and low-skill tasks while upskilling remaining workers into higher-value roles that command better wages and retention.
This is not a future problem. It is a right-now crisis. The NAM (National Association of Manufacturers) projects 2.1 million manufacturing jobs will go unfilled by 2030 due to retirements and skills gaps.
Plants are already running short-staffed, forcing overtime, declining orders, and losing contracts to competitors who automated earlier. Here is the full breakdown of how industrial automation solves labor shortages without mass layoffs.
Industrial automation solves labor shortages without mass layoffs. Here is what actually happens when a plant automates:
Repetitive manual tasks (palletizing, sorting, basic inspection, material handling) get automated
Workers move to supervisory, programming, and maintenance roles
Average wages increase 15-25% for remaining positions
Turnover drops because the work is less physically punishing
The plant can run 3 shifts without tripling headcount
Collaborative Robots: The Middle Ground
Cobots work next to people with no safety cage, cost 60-70% less than industrial robots, and reprogram in hours.
Collaborative robots (cobots) work alongside humans without safety cages, handling 5-25kg payloads at speeds safe for shared workspaces - filling labor gaps on specific tasks while costing 60-70% less than traditional industrial robots to deploy and reprogram.
Cobots are not a replacement for heavy industrial robots. They are a different tool for a different problem.
A 6-axis industrial robot welds car frames at 2 meters per second behind a laser curtain. A cobot hands parts to an assembler, tends a CNC machine, or applies sealant to electronics - right next to a human operator.
The deployment math: a cobot cell costs $35K-$150K including end-of-arm tooling, programming, and integration. Traditional robot cells start at $150K and commonly reach $500K+.
Cobots can be reprogrammed for a new task in 2-4 hours by trained operators. Traditional robots need specialist integrators and weeks of commissioning.
For plants dealing with labor shortages on specific stations - not entire lines - cobots fill the gap at a fraction of the cost and timeline.
PLC Automation and SCADA: The Control Backbone
PLCs run every sensor and motor on your floor. SCADA ties it all together. Most plants run 10-20 year old systems that can not talk to anything modern.
PLC automation forms the real-time control backbone of every automated plant - executing logic scans in 1-10 milliseconds, coordinating thousands of I/O points, and feeding operational data to SCADA systems that provide plant-wide visibility and historical trending for management decisions.
Every sensor, actuator, motor drive, and safety device on your floor connects back to a PLC. It is the nervous system.
SCADA sits above it as the brain - aggregating data from multiple PLCs, displaying it on operator screens, logging it for compliance, and triggering alarms when things drift out of spec.
The problem in 2026: most plants run PLCs that are 10-20 years old. They work fine for basic control. But they cannot export data to modern analytics platforms without expensive middleware.
They do not support cybersecurity protocols. And when they fail, replacement parts come from eBay because the manufacturer discontinued them.
When to Upgrade vs. When to Retrofit
No Ethernet or security on your PLCs? Replace them. If they still work and budget is tight, add a gateway to pull data out.
Upgrade PLCs when they lack Ethernet/IP connectivity, run discontinued firmware, have no cybersecurity features, or cannot support additional I/O expansion - but retrofit with gateway devices and protocol converters when the existing control logic is stable and the budget is under $200K.
The decision framework:
Retrofit (add connectivity to existing PLCs): Best when your control logic works, you just need data extraction. Cost: $20K-$100K for gateway devices and OPC-UA servers. Timeline: 2-6 weeks.
Partial upgrade (replace oldest PLCs, keep newer ones): Best when some controllers are end-of-life but others have 5-10 years remaining. Cost: $100K-$500K. Timeline: 2-4 months.
Full upgrade (new PLC platform across the plant): Best when you are already planning a major line expansion or product change. Cost: $500K-$3M+. Timeline: 6-18 months.
The mistake is doing a full upgrade when a retrofit would get you 80% of the benefit at 20% of the cost. See exactly how industrial automation upgrades your existing systems without ripping out what already works. Start with data extraction. Prove the value.
Then budget the full upgrade with hard evidence of what the data visibility enabled.
How Competitors Use Industrial Automation to Win Market Share
Automated competitors ship 40-60% faster with 5-10x fewer defects. Their cost structure lets them price below you and still grow their margins.
Competitors using industrial automation win market share through three mechanisms: faster fulfillment (lead times 40-60% shorter), higher quality (defect rates 5-10x lower), and lower pricing enabled by automated cost structures - forcing manual competitors into a death spiral of margin compression.
This is the part nobody wants to hear. Your competitors are already using industrial automation to win contracts that used to be yours. Here is how:
Speed advantage: Automated plants quote 2-3 week lead times where manual plants quote 6-8 weeks. Procurement teams choose speed when quality is equal.
Quality advantage: When your defect rate is 3% and theirs is 0.3%, their warranty costs are 10x lower. They can price more aggressively and still make margin.
Scalability advantage: They can take a rush order for 50,000 units without hiring temp workers, training them, and praying for quality. Their system scales linearly. Yours scales chaotically.
The compounding effect is brutal. Better quality means fewer returns, which means higher customer lifetime value, which means more profit to reinvest in more automation.
It is a flywheel that accelerates the gap between leaders and laggards every quarter. Think of it as your factory's life jacket - the longer you wait, the harder it is to stay afloat.
Industrial Cybersecurity: Protecting Your Automated Plant
OT Cybersecurity: Investment vs. Breach Cost
Manufacturing became the #1 targeted sector for ransomware in 2025. The math on prevention vs. recovery is not close.
Manufacturing became the #1 ransomware target in 2025. A basic OT security stack runs $95-250K. The average ransom demand was $4.4M last year.
Industrial cybersecurity protects automated manufacturing systems from attacks that can halt production, damage equipment, or compromise product safety - requiring OT network segmentation, zero-trust architecture, encrypted communications, and continuous monitoring of all PLC and SCADA traffic.
The more you connect, the more you expose. Every sensor feeding data to the cloud is a potential entry point. Every remote access connection for vendor support is a door.
In 2025, manufacturing became the #1 targeted sector for ransomware attacks - surpassing healthcare and finance. The full playbook for securing industrial automation from cyber risks starts with knowing your exposure points.
The attacks are not theoretical. Colonial Pipeline. JBS Foods. Norsk Hydro. Each one caused hundreds of millions in damages.
Those were large companies with security budgets. Mid-market manufacturers running flat networks with no segmentation between IT and OT are sitting targets.
The Minimum Viable Cybersecurity Stack for OT
For $95-250K: firewall between IT and OT, device tracking, MFA on remote access, and a 4-hour recovery plan.
The minimum viable OT cybersecurity stack includes network segmentation (DMZ between IT and OT), asset inventory and monitoring, patch management for PLCs and HMIs, multi-factor authentication for remote access, and incident response planning with 4-hour recovery time objectives.
Here is what "good enough" looks like for a mid-size plant:
Segment your network: Put a firewall/DMZ between your IT network (email, ERP) and your OT network (PLCs, SCADA, HMIs). Zero direct paths between them. Cost: $30K-$80K.
Inventory every connected device: You cannot protect what you do not know exists. Map every PLC, switch, sensor gateway, and HMI on your OT network. Tools like Claroty or Nozomi do this passively. Cost: $40K-$100K annually.
Control remote access: No open VPNs. No shared passwords. Every vendor gets a unique, time-limited, MFA-protected session that gets logged and recorded. Cost: $15K-$40K.
Plan for failure: Assume you will get breached. Have a tested plan to isolate affected segments, switch to manual operation, and recover within 4 hours. Cost: internal time + $10K-$30K for tabletop exercises.
Total minimum investment: $95K-$250K. Compare that to the average ransomware demand in manufacturing ($4.4M in 2025) plus 3-4 weeks of production downtime.
The math is not close. Every connected PLC without network segmentation is an open invitation. The question is not whether to invest in industrial cybersecurity - it is whether you do it before or after the breach forces your hand.
Implementation Roadmap: From Assessment to Full Deployment
Industrial Automation Implementation Roadmap
Four-phase deployment sequence with built-in ROI gates. Each phase must prove value before advancing.
Four phases that work: assess in 6 weeks, pilot one line for 6 months, scale in 12 months, then optimize. Each phase must prove ROI before the next.
A successful industrial automation implementation follows a 4-phase roadmap - Assessment (4-6 weeks), Pilot (3-6 months on one line), Scale (6-12 months across the plant), and Optimize (ongoing) - with each phase requiring proven ROI before advancing to the next.
Do not try to automate everything at once. Plants that attempt "big bang" deployments fail 60% of the time. Here is the sequence that works:
Phase 1 - Assessment (4-6 weeks)
Audit current OEE (Overall Equipment Effectiveness) across all lines
Identify the 3 biggest sources of downtime, scrap, and labor cost
Map existing PLC and network infrastructure
Calculate baseline costs for comparison
Phase 2 - Pilot (3-6 months)
Deploy automation on ONE line or ONE high-impact problem
Predictive maintenance on your most failure-prone asset is the typical starting point
Measure actual vs. projected savings weekly
Document integration challenges and training needs
Phase 3 - Scale (6-12 months)
Expand proven solutions to additional lines
Build internal expertise (reduce vendor dependency)
Connect pilot systems to plant-wide analytics
Establish cybersecurity monitoring as you add connections
Phase 4 - Optimize (Ongoing)
Use accumulated data to refine ML models
Pursue advanced applications (digital twins, autonomous quality control)
Benchmark against industry leaders
Reinvest savings into advanced capabilities
The pilot phase is where most value gets proven - and where most projects die if leadership expects instant results. If your industrial automation is failing you, the root cause is almost always skipping this step. Set expectations: 6 months to prove it, 18 months to full ROI.
One more thing: document everything during the pilot. Maintenance hours saved, downtime events avoided, scrap rate changes, energy consumption deltas.
This data becomes the business case that funds Phase 3. Without hard numbers, the CFO will not sign off on scaling - no matter how well the pilot performed on the floor. See how process automation pays for itself within 90 days when you frame it correctly for finance.
Frequently Asked Questions
What is the average payback period for industrial automation in mid-size manufacturing?
How much does a basic predictive maintenance system cost to deploy?
Can industrial automation work with legacy PLCs and existing equipment?
What is the difference between fixed automation and flexible automation?
How do you measure industrial automation ROI beyond labor savings?
Conclusion
Start with your worst-performing asset. Run one predictive maintenance pilot for 6 months. The savings data from that test funds everything else.
Pick your highest-downtime asset, deploy one predictive maintenance pilot, and measure the results for 6 months. The data builds the business case for everything else. Talk to KGT Solutions to scope your first pilot - we deploy industrial automation systems that prove ROI before you scale.
Sources:
Fortune Business Insights. $299.21B in 2026, projected $632.12B by 2034.
U.S. Department of Energy. PdM reduces breakdowns 70-75%, cuts maintenance costs 25-30%.
Deloitte & The Manufacturing Institute / NAM.
Industrial Cyber. 1,466 incidents, #1 targeted sector.
Sophos. Average ransom demands doubled to $1.16M.
Relia Magazine / Aberdeen Research. Average $260K/hour.
iFactory. AI vision achieves 95-99% accuracy vs. 70-80% human.
Standard Bots. Cobots $25K-$90K standalone, $150K-$300K integrated.
MarketsandMarkets. Cobot market $3.38B by 2030.
Coherent Market Insights. Market valued at $261.23B in 2026, 9.7% CAGR through 2033.
Industrial Autonomous Floor
Newsletter
Actionable insights on industrial AI, automation, and smart operations built for safe, secure, and compliant real-world environments.